25. Evaluating Your Model
Evaluating Your Model
ND320 C2 L3 18 Evaluating Your Model Walkthrough Pt 1
ND320 C2 L3 19 Evaluating Your Model Walkthrough Pt 2
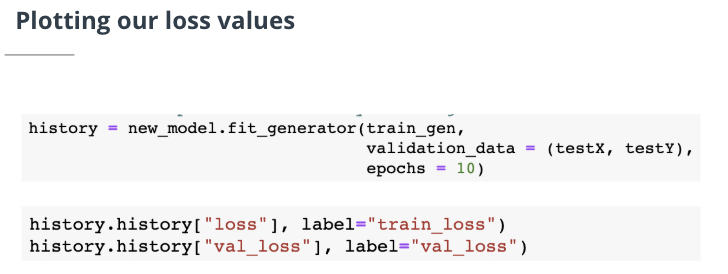
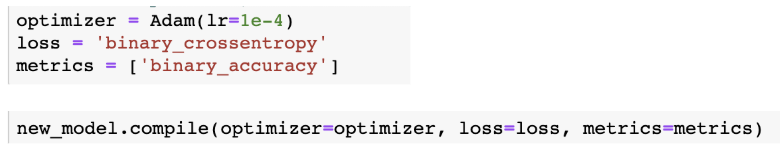
Note: The history.history function stores the loss value. Then you can use your choice of plot function such as matplotlib.pyplot.plotto plot the loss values.

Summary
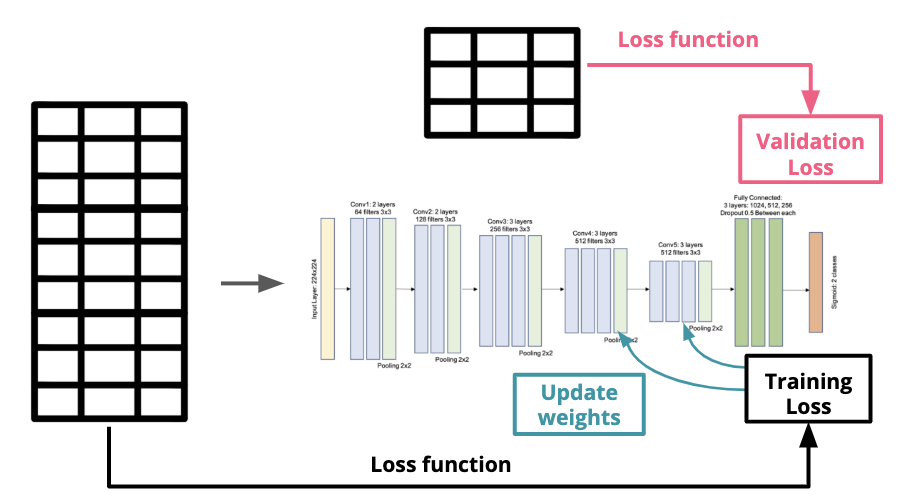
Loss and loss function
Each time the entire training data is passed through the CNN, we call this one epoch. At the end of each epoch, the model has a loss function to calculate how different its prediction from the ground truth of the training image, this difference is the training loss. The network then uses the training loss to update the weights of filters. This technique is called back-propogation.
At the end of each epoch, we also use that loss function to evaluate the loss on the validation set and obtain a validation loss that measures how the prediction matches the validation data. But we don’t update weights using validation loss. The validation set is just to test the performance of the model.
If the loss is small, it means the model did well classifying the images that it saw in that epoch.
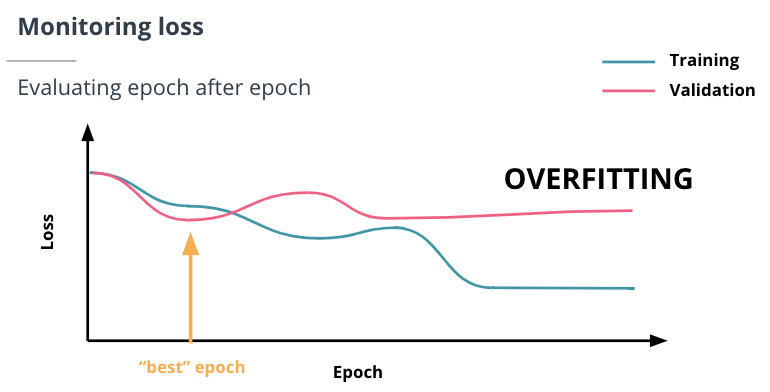
Overfitting
If the training loss keeps going down while the validation loss stops decreasing after a few epochs, we call the model is overfitting. It suggests the model is still learning how to better classify the training data but NOT the validation data.
Prevent overfitting
To avoid overfitting, we can A) changing your model’s architecture, or B) changing some of the parameters. Some parameters you can change are:
- Batch size
- Learning rate
- Dropout
- More variation on training data